Public EV Charging Operators: How to Compare Site Utilization, Tariffs, and O&M Costs
For public EV charging operators, the real comparison is not charger count alone. Asset quality depends on how often a site is used, how pricing converts demand into revenue, and how maintenance spending protects uptime without eroding margin.
That balance matters more now because charging infrastructure sits at the intersection of mobility, electricity markets, digital platforms, and long-life energy assets. A busy location can still underperform if tariffs are poorly structured or O&M costs rise faster than throughput.
From the perspective of EPEM’s broader energy coverage, EV charging is no longer a standalone retail service. It is part of grid modernization, distributed energy planning, and long-term infrastructure economics.
Why comparison has become more complex
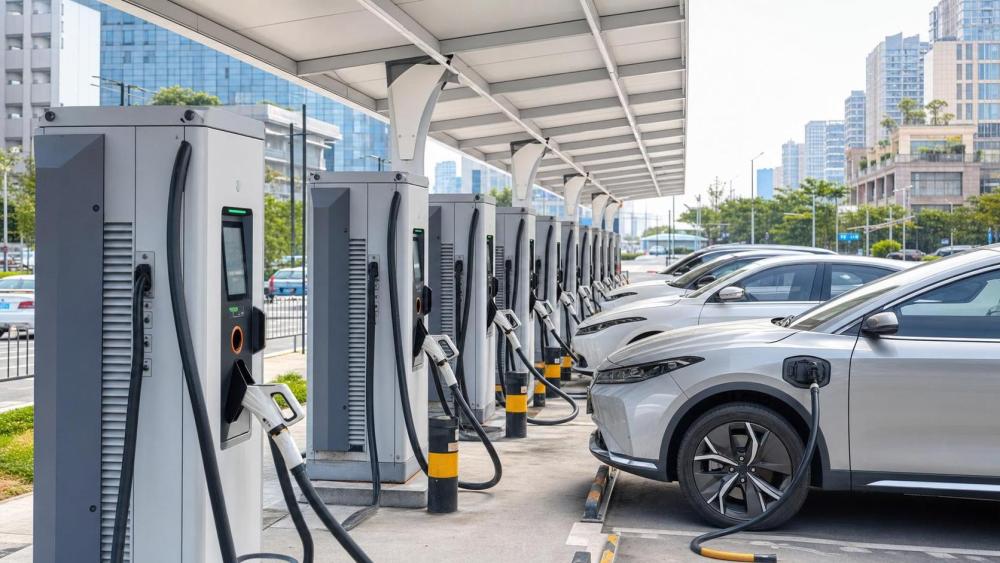
Public charging networks used to be assessed mainly by rollout speed. That approach is no longer enough. Competitive pressure, power pricing volatility, and reliability expectations have changed what good performance looks like.
Public EV charging operators now manage assets that must satisfy drivers, landlords, utilities, software providers, and investors at the same time. Each stakeholder sees performance through a different metric.
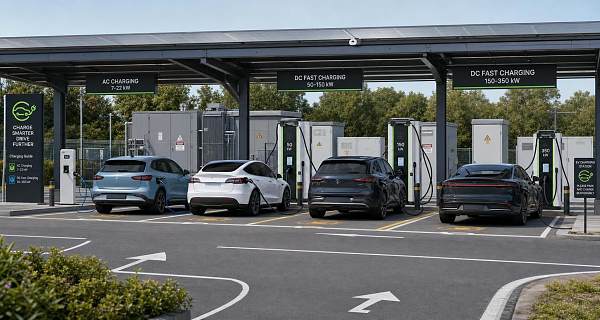
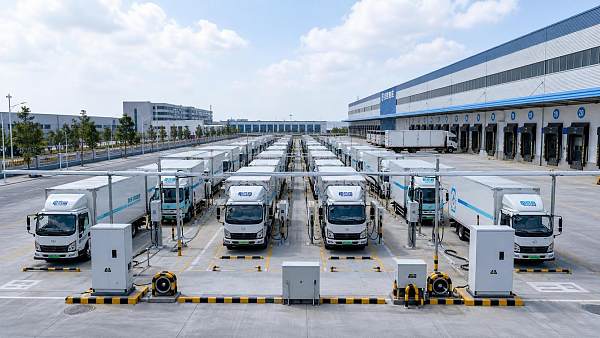
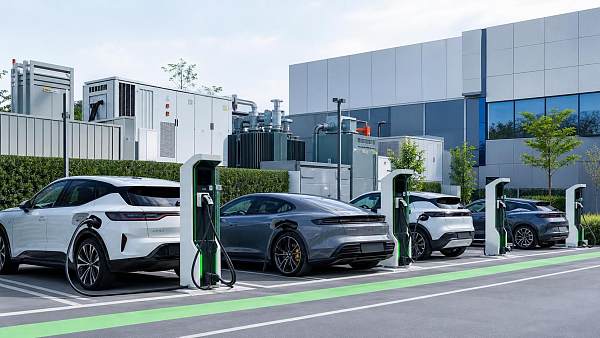
A station beside a highway may prioritize high-power turnover. A city-center site may depend on dwell time, parking rules, and mixed charging behavior. A fleet-accessible location may value predictability over peak retail margin.
This is why comparing utilization, tariffs, and O&M costs together is more useful than looking at each item in isolation. The economics of one variable always reshape the others.
What site utilization really means
Utilization is often reduced to charger occupancy or energy dispensed. In practice, public EV charging operators need a broader definition that links technical use to commercial output.
A useful view includes session count, average kWh per session, peak-hour loading, queue risk, dwell time, and uptime-adjusted availability. These indicators reveal whether demand is healthy, distorted, or operationally fragile.
Low utilization does not always mean a bad site. It may reflect early-market timing, limited EV penetration, poor signage, payment friction, or insufficient local awareness. High utilization is also not automatically positive.
Very high utilization can indicate underbuilt capacity. That may create queues, customer dissatisfaction, and accelerated component wear. Over time, those effects can increase service cost and reduce repeat usage.
Metrics worth tracking together
- Energy sold per connector per day
- Sessions per connector per day
- Average charging duration and idle time
- Utilization by hour, weekday, and season
- Uptime-adjusted revenue rather than nameplate capacity
- Share of repeat users versus transient traffic
For public EV charging operators, the most valuable utilization benchmark is usually site-specific. Comparing urban AC charging with highway ultra-fast charging on one scale can produce weak conclusions.
Tariffs shape demand more than many operators expect
Tariffs are not just a billing mechanism. They influence session behavior, charger turnover, customer retention, and the ability to recover fixed infrastructure cost.
A flat energy price is simple, but simplicity can hide lost value. Peak congestion, parking overstay, and high demand charges may require time-based or hybrid pricing approaches.
On the other hand, tariff structures that are too complex can discourage usage. Drivers tend to respond better when they can understand price logic before plugging in.
For public EV charging operators, a tariff should reflect local electricity cost, charger power level, expected session mix, and competitive alternatives nearby. It should also support future pricing flexibility.
Common pricing lenses
The best tariff is rarely the highest one. A slightly lower rate may improve utilization enough to create stronger gross margin and better asset rotation over time.
O&M costs are a strategic variable, not a back-office detail
Maintenance is often discussed after deployment, yet it strongly determines long-term network economics. Public EV charging operators with weak maintenance planning usually pay more through downtime than through direct repair bills.
O&M costs include preventive inspections, corrective repairs, spare parts, software support, payment system management, field response, cleaning, communications, and sometimes security or civil upkeep.
The cost structure changes by charger type. AC assets may have lower unit service cost but wider geographic dispersion. High-power DC sites may need fewer visits, yet each failure can destroy more revenue.
A low upfront equipment price can therefore be misleading. If parts availability is weak, remote diagnostics are limited, or firmware support is fragmented, lifetime service cost may rise sharply.
Where O&M comparisons usually become clearer
- Mean time to repair and mean time between failures
- Remote reset success rate
- Parts commonality across charger models
- Service coverage by region and dispatch speed
- Payment, backend, and firmware integration quality
- Grid connection resilience and power quality issues
In energy markets covered by EPEM, these details matter because charging hardware is increasingly tied to digital control, smart metering, storage integration, and demand management.
Reading the economics at site level
A practical comparison starts with the site, not the network average. Public EV charging operators should evaluate each location as a micro-business shaped by traffic, power cost, land terms, and service model.
Highway corridors, retail destinations, apartment clusters, transit nodes, and logistics routes each produce different charging patterns. Their tariff tolerance and maintenance burden also differ.
The table below shows how the same core metrics can lead to different conclusions across site types.
This site-level view helps explain why some networks expand carefully while others chase visible footprint and later struggle with economics.
What should be benchmarked before expansion
Before adding new sites, public EV charging operators usually benefit from a disciplined benchmark across existing assets. Expansion decisions are stronger when they rely on normalized internal data.
That means separating temporary ramp-up effects from structural underperformance. A new station may need time. A mature station with recurring faults or tariff mismatch signals a different problem.
Useful review questions include:
- Is utilization constrained by demand, access, or equipment availability?
- Does the tariff reflect local power charges and user willingness to pay?
- Which service failures create the biggest revenue leakage?
- Are software and payment issues causing hidden abandonment?
- Would storage, load management, or grid upgrades improve the economics?
This is where an intelligence platform such as EPEM is useful. Charging performance is increasingly linked with grid constraints, energy storage options, equipment quality, and regional infrastructure policy.
A stronger framework for next decisions
For public EV charging operators, better decisions usually come from treating utilization, tariffs, and O&M as a single operating framework. Each variable changes asset value, and none should be judged in isolation.
A practical next step is to rank sites by revenue quality, not only by volume. Then compare pricing logic against local energy cost and map maintenance spending against avoided downtime.
That approach creates a clearer basis for retrofit, repricing, relocation, or expansion. In a market where charging infrastructure is becoming core energy infrastructure, disciplined comparison is increasingly the difference between network growth and durable returns.
Questions about market trends? Contact Market Scope Live for deeper business insights.
We respect your privacy. Your information is strictly confidential.
Related News
 EV Charging InfrastructureIndian Minister Proposes Lower EV Charging Rates to Encourage AdoptionIndia EV charging rates could fall in Maharashtra under Nitin Gadkari’s proposal. Explore the potential impact on drivers, fleets and charging operators.MORE+
 EV Charging InfrastructureEV Charging for Industrial Parks: Sizing Capacity and Managing Peak LoadsPlan industrial parks EV charging with confidence. Learn how to size capacity, manage peak loads, reduce demand costs, and keep fleets ready without disrupting production.MORE+
 EV Charging InfrastructureArlington County, Virginia, to Raise Public EV Charging Rates by 72%Arlington County public EV charging rates will rise 72% to $0.30/kWh on November 1, 2026. Explore the potential impact on fleet budgets and how businesses can prepare.MORE+
 EV Charging InfrastructurePlanning Solar EV Charging Hubs: Sizing PV, Battery Storage, and Grid CapacityPlan solar EV charging hubs with confidence. Learn how to size PV, battery storage, and grid capacity to meet peak demand, control costs, and support reliable charging.MORE+
 EV Charging InfrastructureChery Unveils 1.44 MW Charging System, Claims 500 km of Range in Five MinutesChery’s 1.44 MW charging system claims 500 km of range in five minutes. Explore its ultrafast EV charging technology, vehicle compatibility and global rollout plans.MORE+
 EV Charging InfrastructureComparing EV Charging Equipment Manufacturers: Warranty, Lead Times, and SupportCompare EV charging equipment manufacturers on warranty coverage, lead times, and support. Discover how to reduce downtime, uncover hidden costs, and choose the right supplier.MORE+
 EV Charging InfrastructurePlanning Urban EV Charging Hubs: Site Selection, Power Needs, and Charger MixPlan urban EV charging hubs with confidence. Discover how to select sites, size power capacity, and balance AC/DC chargers to control costs and deliver reliable charging.MORE+
 EV Charging InfrastructureHow to Plan Charging Corridors for Fleet Routes, Grid Capacity, and Future DemandCharging corridor infrastructure planning helps fleets align routes, grid capacity, reliable charging, and scalable site design for future demand.MORE+
 EV Charging InfrastructureHow to Size Fast EV Charging Equipment for Fleet Depots Without OverbuildingFast EV charging equipment for fleet depots: learn how to match power, charging windows, grid capacity, and smart controls without costly overbuilding.MORE+
 EV Charging InfrastructureHow to Plan EV Charging Infrastructure in Indonesia for Fleet and Public SitesCharging infrastructure planning in Indonesia for fleet and public sites: optimize energy, grid capacity, smart load management, safety, and scalable EV charging.MORE+
 EV Charging InfrastructureHow to Size DC EV Charging Equipment for Fleet Depots and Peak DemandDC EV charging equipment sizing guide for fleet depots: balance energy demand, peak loads, utility limits, smart charging, and scalable growth.MORE+
 EV Charging InfrastructureAre EV Charger Payment Systems Interoperable Across Regions?Are there interoperability standards for EV charger payment systems across regions? Explore OCPP, OCPI, Plug & Charge, roaming, and payment strategies for seamless EV charging.MORE+
 EV Charging InfrastructureHow to Evaluate Total Cost of Ownership for a Fleet DC Charging DepotHow to evaluate total cost of ownership for a fleet DC charging depot: compare grid costs, tariffs, uptime, smart charging, and scalable infrastructure.MORE+
 EV Charging InfrastructurePublic Charging Infrastructure Planning: Site Criteria, Grid Capacity, and UtilizationPublic charging infrastructure planning made practical: evaluate site access, grid capacity, utilization, and scalable design to build reliable, investable EV charging hubs.MORE+
 EV Charging InfrastructureHow Behind-the-Meter Energy Systems for EV Charging Cut Peak-Demand CostsBehind the meter energy systems for EV charging help cut peak-demand costs, defer grid upgrades, and improve charging reliability with storage and smart controls.MORE+
 EV Charging InfrastructureIs Building a Public EV Charging Network in Rural Areas Financially Viable?Is it financially viable to build public charging networks in rural areas? Explore grid costs, utilization, funding, AC/DC choices, and strategies for profitable rural EV charging.MORE+
 EV Charging InfrastructureHow Public EV Charging Load Management Prevents Peak Demand and Grid Overloadspublic EV charging load management prevents costly peak demand and grid overloads. Explore smarter controls, capacity planning, and scalable charging performance.MORE+
 EV Charging InfrastructureHow to Assess Long-Term EV Charger Reliability Before ProcurementHow to evaluate long-term reliability of EV chargers before procurement? Explore practical checks for uptime, grid compatibility, software stability, service support, and lifecycle costs.MORE+
 EV Charging InfrastructureIs AC Charging Still Worth Investing in for New Public Stations in 2026?Is AC charging still worth investing in for new public stations in 2026? Explore where smart, managed AC charging delivers value, revenue, and scalable EV infrastructure.MORE+
 EV Charging InfrastructureHow to Plan Power Capacity for Highway EV Charging CorridorsHighway charging corridor power capacity planning: learn how to size grid connections, manage peak demand, use storage, and phase EV hubs for reliable, scalable growth.MORE+
 EV Charging InfrastructureWhat Is the Typical BMS Failure Rate in EV Charging Equipment?Battery management system failure rate in charging equipment: learn what BMS faults mean, key risks, and how to protect EV charger uptime.MORE+
 EV Charging InfrastructureHow Should Fleet Depot Charging Stations Be Laid Out?Fleet depot charging station layout design guidelines for safer vehicle flow, smart power use, scalable infrastructure, and reliable fleet readiness. Explore practical planning tips.MORE+
 EV Charging InfrastructureDC Fast Chargers vs Liquid-Cooled Ultra-Fast Chargers in 2026DC fast charger vs liquid-cooled ultra-fast charging stations 2026: compare power, costs, grid demands, uptime, and ideal deployment scenarios for smarter EV infrastructure.MORE+
 EV Charging InfrastructureWhat Does the Global EcoPower Charging Intelligence Platform Do?Global EcoPower EV charging infrastructure intelligence platform delivers actionable insights on grid capacity, storage, technology, risk, and profitable charging project planning.MORE+
 EV Charging InfrastructureHow Global EcoPower Manages Energy Across EV Charging NetworksGlobal EcoPower energy management systems for charging networks optimize EV charging with dynamic load control, storage, solar integration, and reliable data insights.MORE+
 EV Charging InfrastructureWhat Switchgear Specifications Are Needed for a 500 kW Charging Site?What switchgear specifications are required for a 500kW charging installation? Explore load sizing, transformer selection, fault ratings, protection, and expansion planning.MORE+
 EV Charging InfrastructureWhich Communication Protocols Matter When Mixing Charger Brands?What communication protocols matter most when mixing charger brands at one station? Explore OCPP, OCPI, ISO 15118, and energy controls for reliable interoperability.MORE+
 EV Charging InfrastructureWhat Grid Connection Capacity Does a 10-Bay Fast Charging Hub Need?What grid connection capacity is needed for a 10-bay fast charging hub? Explore demand, power sharing, batteries, and scalable planning for reliable EV charging.MORE+
 EV Charging InfrastructureHow to Plan EV Charging Systems for Apartments Without Overloading the Building?EV charging systems for apartments start with capacity, not charger count. Learn how to prevent overloads, use smart load management, and plan scalable charging that fits your building.MORE+
 EV Charging InfrastructureHow City Charging Infrastructure Planning Can Reduce Costs and Avoid Grid BottlenecksCharging infrastructure planning for cities helps cut costs, avoid grid bottlenecks, and speed EV rollout with smarter, scalable deployment.MORE+
 EV Charging InfrastructureEU Mandates EN 61851-23:2026 for EV ChargersEU Mandates EN 61851-23:2026 for EV Chargers: learn how the new EU rule impacts certification, customs clearance, and market access before October 2026.MORE+
 EV Charging InfrastructureITC Ruling Puts Chinese EV Chargers Under 337 PressureITC ruling on Chinese EV chargers puts Section 337 pressure on imports, compliance, and OEM supply chains. Learn how patent risks may impact U.S. customs, distributors, and EV charger sourcing.MORE+
 EV Charging InfrastructureHow EV Charging Technology Affects Charging Speed, Compatibility, and Site PlanningEV charging technology shapes real charging speed, vehicle compatibility, and site planning. Learn how to avoid costly design mistakes and build charging projects that perform.MORE+
 EV Charging InfrastructureUS Requires UL 1741 SA-2025 EVSE ModulesUS Requires UL 1741 SA-2025 EVSE Modules for imported DC fast chargers. Learn how V2G, FCC+UL testing, and firmware compliance will reshape US market access.MORE+
 EV Charging InfrastructureUSTR Opens Section 301 Review on China EV ChargersUSTR Opens Section 301 Review on China EV Chargers: learn how the 25% tariff review may affect import costs, customs compliance, and procurement timing across EV charging and BESS supply chains.MORE+
 EV Charging InfrastructureHow to Plan Fleet Charging Infrastructure for Logistics Depots and Delivery HubsFleet charging infrastructure for logistics starts with duty cycles, dwell time, and grid limits. Learn how to design depot and hub charging that cuts bottlenecks and supports scalable fleet electrification.MORE+
 EV Charging InfrastructureWhat Is Load Management in EV Charging and How Does It Reduce Peak Power Costs?Load management in EV charging helps control peak demand, lower grid upgrade pressure, and cut costly power spikes. Learn how smart power allocation improves site economics.MORE+
 EV Charging InfrastructureHow to Evaluate an EV Charging Software Platform for Multi-Site Charging OperationsEV charging software platform evaluation made practical: learn how to assess interoperability, load management, billing, security, and scalability for multi-site charging operations.MORE+
 EV Charging InfrastructureUSTR Opens 301 Review on China EV Charging GearUSTR opens a Section 301 review on China EV charging gear, putting tariffs, import costs, pricing, and inventory plans at risk. See what US importers and distributors should watch now.MORE+
 EV Charging InfrastructureEU Sets 17.1% Duty on Chinese EV ChargersEU Sets 17.1% Duty on Chinese EV Chargers: see how the new EU tariff affects EV charging equipment exports, customs costs, HS codes, and contract risks for suppliers.MORE+